 As we enter another political cycle with the inevitable bombardment of ads, I wanted to know who was really influencing what we see and hear. In the USA this data is available for all of us to examine. However, actually taking the time to examine it is not something everyone can do, so I thought it might be helpful to start applying my skills to disseminate this information.
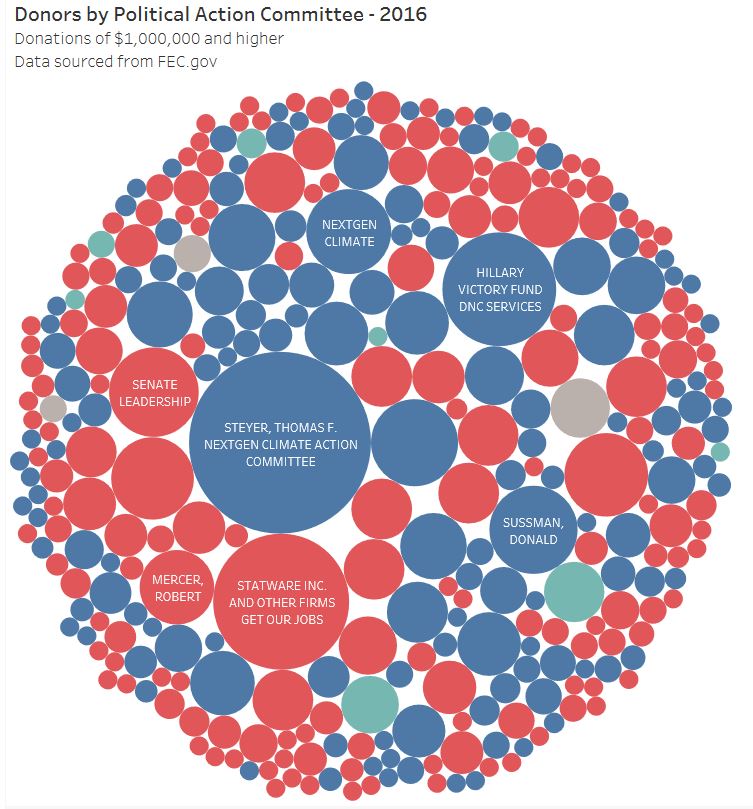
This is my first post of a series that I am developing that will attempt to show the flow of money into and out of our political system. All of the data has been sourced from FEC.gov and has not been manipulated in any way. The visualizations I have created show individual contributions of $1,000,000 and more. Donors can be either individuals or entities, the recipients are PACs. What I found interesting is that extremely large donations occur for both parties and that there are a few individuals and families who donate enormous amounts. Take a look and let me know what you would like to see next! Follow me to see more, I plan on posting several times a week as I have A LOT OF DATA! Click here for the interactive visual.
1 Comment
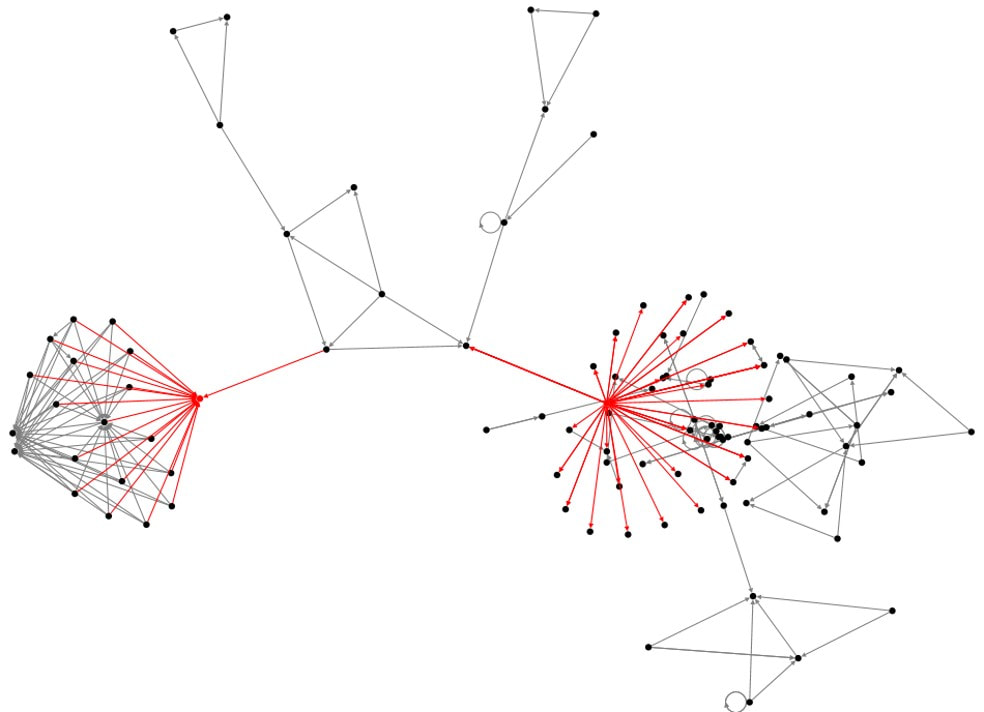 We all know that social media can be an extremely cost effective method of marketing. However, in order for it to be effective, its critical to find those that truly have influence over the issues that you are promoting. That's where social network diagrams like the one below play a critical role. Being able to quickly visualize your network and then identify those that have the most influence will enable you to reach out to them with targeted messages that they are likely to respond to. Static images are not sufficient for this analysis, its critical to be able to interact with the data and try different visuals. This image shows the last 50 tweets for hashtag#Election2020. Notice the two dots highlighted in red, these are the key influencers with significant reach.
Do you know who your influencers are? 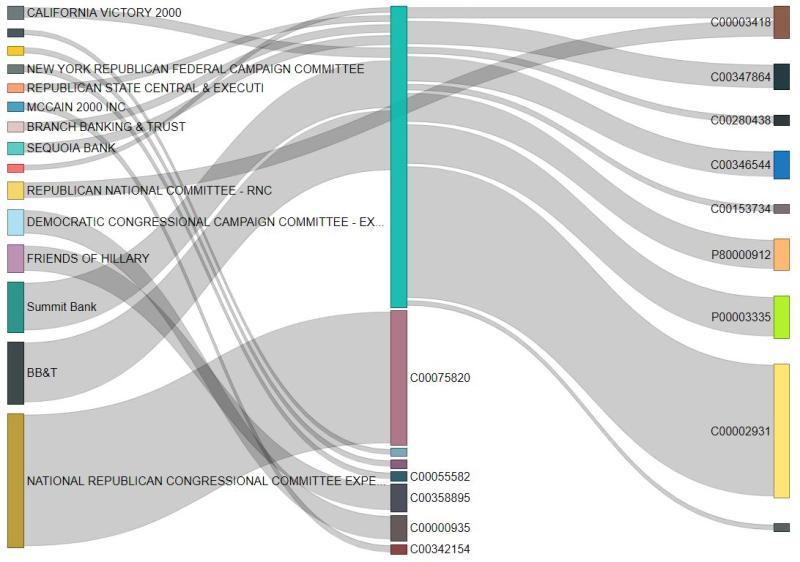 Creating visualizations of relationships within data sets can be challenging for even the most experienced data scientist. One great tool is the Sankey diagram that shows the strengths of relationships between multiple parties. Building on the Campaign Finance Data set I created, this diagram shows the flow of funds between political entities in 2018. To keep the diagram as simple as possible, this shows transactions of $1MM or more.
I intentionally did not label the recipients of the funds to avoid any heated discussions. However, its fairly clear that some groups are the true influencers of others but remain hidden from public view. By understanding the true flow of money through the system we can identify who the real power players are. What do you think will happen during this cycle? 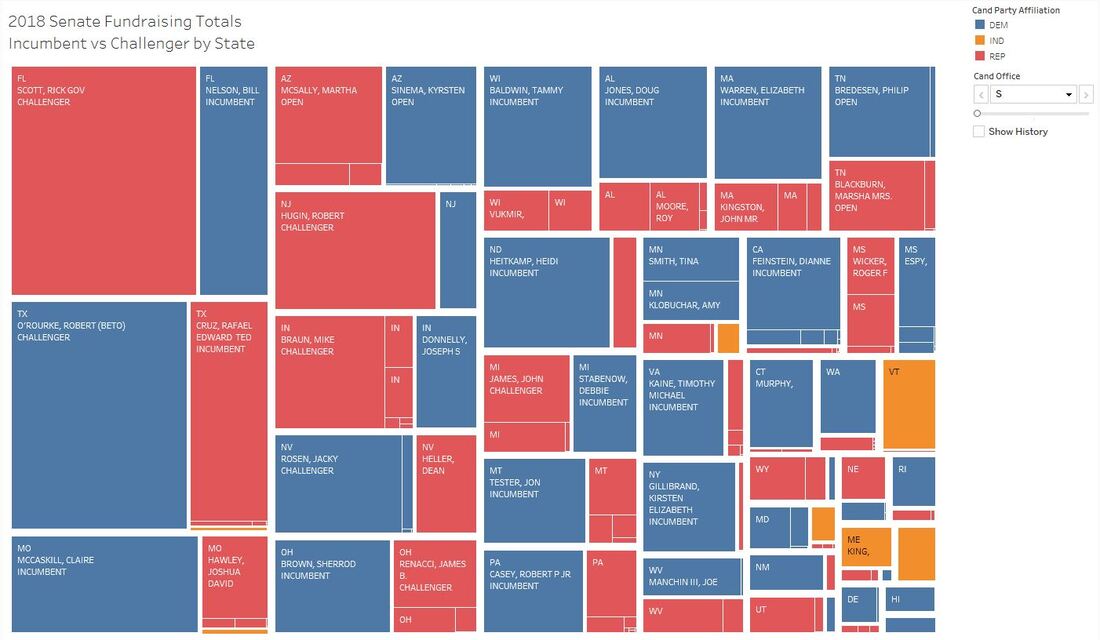 If we could bet on politics an extremely safe one would be betting that incumbent Senators would win re-election. According to OpenSecrets, since 1964 the average re-election rate for the Senate has been higher than 82%. That's a safe bet.
Why? Incumbents have a massive advantage in fundraising over their challengers. The analysis below shows that in 2018, outside of a few high profile races, the incumbent had raised substantially more than their challenger. However, there is hope in that in 3 of the 5 biggest races (Florida, Indiana, and Nevada) the challenger had raised more than the incumbent and won the seat. Of particular interest was Arizona where the seat was open and the amount of funds raised were approximately equal between the two parties. Want to interact with the data? Click here. Another month end means another round of the same questions. What went well, what went badly and what does that mean going forward? In most organizations all of the effort is spent on answering the first set of questions – the ones about what happened. Precious little time is spent answering or even attempting to answer the last one – what does the future look like? Obviously, it’s critically important to know and accurately record performance from both a practical and regulatory perspective. But that is not sufficient, especially in today’s highly complex, rapidly changing and constantly evolving marketplace. Companies cannot operate on autopilot and must adapt their tactics to meet challenges wherever they arise and take advantage of opportunities when they appear.
Senior executives are aware of this and it is why they are asking for forecasts with more frequency and with more detail. They expect that the books will be closed properly and accurately, but they want to know what decisions need to be made going forward and what the impact of these decisions will be. They are also keenly aware that the existing management tools are woefully inadequate in solving this problem. Think about the title of this post for just a moment. How far into the future can you really see? Do you know what is going to happen next month, next week, tomorrow or even one minute from now? At an elemental level, it is impossible to know what the future will bring, there may be a natural disaster, political upheaval, or economic calamity all of which are out of your control. You have more control on an individual level in that you can be fairly certain that with the proper precautions you will arrive at work safely, conduct business, return home safely, go to sleep and repeat again tomorrow. The closer the event the more certain we become of it materializing the way that we had expected.
The same rules apply in our professional lives. As the month draws closer to close, we become more certain of the accuracy of our predictions for sales, operating expense, profits, etc. The question is how far into the future can you see and be comfortable with the likelihood of results materializing the way that you have forecasted. Is it one week, one month, one year or more? What are the driving forces behind that timeline and how can we alter it? For most organizations, the forecast horizon is dependent on the industry in which you operate and the level of volatility and change that industry is experiencing. This volatility can come from internal or external factors and can be minor or extreme. However, it is the industry that has the greatest impact on the forecast horizon as it dictates the business cycle. For example, if your business is manufacturing capital intensive products with long lead times such as construction equipment, aircraft or defense it is likely that you operate on very long lead times for design, sales and contracts. Due to the size and lengths of the contracts it allows for longer planning horizons for material purchases, staffing and financing. However, if you are in social media or other nascent industries where the rules, players and technologies are changing on an ongoing basis, it makes it very difficult to take a long term view with any certainty. It would not be wise to enter into long term contracts when the short term is unknown. Volatility in both cases can come from within the industry or externally. Two key competitors may merge resulting in a situation where the new entity has pricing power and increased economies of scale in terms of production. Or a major vendor may declare bankruptcy leading to severe issues with your supply chain. Technology advances may diminish or neutralize your competitive advantage. Government regulations may make your market position untenable. In short, almost anything can happen to any organization at any time. Darwin stated that it was not the strongest or the smartest organisms that survived, it was the ones that were most able to adapt to their changing conditions. In order to thrive and survive in a constantly changing world, organizations need to understand how far they can see into the future with a reasonable degree of certainty and have the skills to deal with the inevitable change as it occurs. Those that are able to adapt will thrive while those who can not will be relegated to the footnotes of history. It’s 7 pm midweek in the middle of budget season and if you are like most finance executives you either are in or are about to enter Excel hell! After months of creating budget input templates, instructions and timelines you know that there will still be groups and individuals who have modified the template – making consolidation nearly impossible, others that refuse to follow the guidelines and the rest who ignore your timelines. You know that you will spend the vast majority of time repairing workbooks or chasing people down for missing data.
You know that this time would be better spent identifying markets or products that show real performance potential or areas for material cost savings! Sadly, you will spend most of your time reconciling and validating workbooks so that the numbers are at least correct before you see the CFO. You know you won’t have time to do the part of your job that you truly enjoy and that adds the most value to your organization. All the while, you will be wondering if there is a better way – a way to consolidate all this information simply, effectively and cheaply so that you can get back to the business of business. There is a better way! Fortunately, there are a number of tools available on the market today. They range from simple Excel add-ins to full-featured stand-alone systems. However, this can create a different kind of hell – one where you are still faced with all of the business complexities at your existing budget process buy compounded by inflexible MIS policies and procedures. Implemented poorly, these systems can make Excel hell look like Excel heaven! So what is one to do?
We can help you throughout your journey from vendor selection and proof of concept to resources and architecting your custom solution. Contact us for further information on how to get started. When do you start your budgeting process? How long does it take your firm to complete it? Is it really meaningful after all of that effort? More and more companies are grappling with these questions, especially in light of the constantly changing business conditions.
When the economic climate can swing wildly month over month and natural disasters on the opposite side of the world disrupt supply chains and financial markets, using an outdated process as the primary management tool for allocating resources ceases to make sense. It is now a management necessity to have more flexible and adaptable methods that allow resources to be redeployed and realistic scenarios to be built. These methods include embedding forecasting into the fabric of a firm, focusing on the key operational drivers of the business and developing financial models based on these drivers to make the data accessible to those who need it, when they need it. However, as nirvana-like as this situation may sounds, it’s not realistic to expect to achieve that in the short-term or without some substantial change for your organization. What is more realistic is to create a long-term road map that embraces a series of interlaced and incremental changes. The first of these changes could – and some even say should – involve deploying a formal budgeting tool to replace the Excel spreadsheets that are the default standard in most firms. Simply replacing the manual Excel consolidation process with an automated tool can provide a number of benefits simultaneously:
In the last blog post I defined a rolling forecast and demonstrated how it could be used to improve an organization’s decision making process to allow it to become more nimble and agile. I also rose the question of what should be done with the annual budget. I’d like to take a moment now to provide my thoughts on why the annual budget remains a valuable management tool and why organizations should not be too quick to abandon it.
Much has been written and said on what is wrong with the budget in its current form at most organizations. In summary, the budget:
The bible on budgeting was written almost 90 years ago by the founder of the consulting firm McKinsey & Co, James O. McKinsey. He articulated very clearly how a budget should be created and the value that the budget offers an organization. Though much has changed, many of these values are still applicable today including:
Instead of taking this approach, I recommend that a rolling forecast be used to supplement the annual budgeting process. A rolling forecast, by its very design, is much more nimble and allows for an organization to make decisions and create plans very rapidly. It addresses the core issues and criticisms of the annual budget by being created and managed at a higher level, allows for underlying assumptions to be updated, focuses on the core business drivers and forces an organization to continually plan forward and not to the end of the fiscal or calendar year. In short, the rolling forecast and annual budget when used together effectively, can allow an organization to create accurate long term plans as well as focus on short term execution simultaneously. In today’s rapidly changing world, both skills are critical to ensure success. The first question we almost always get asked by our clients is, “What exactly is a rolling forecast?”
Most people and companies have some form of forecasting in place already to update their full year projections. “Isn’t a rolling forecast just a matter of adding a month or two or three at the end of the budget and lopping off the same number of months from the beginning?” Technically, yes, in its most primordial form, that is all it is. However, since the only tool available to most companies that would enable this is the budget, simply shifting the company’s timelines would result in organizations developing, updating and maintaining detailed budgets on a continuous basis throughout the year. Most would agree that this is not sustainable (if not downright frightening!) and the result is that it will fall by the wayside. The problem is that without taking into consideration all of the other valid and useful purposes the budget serves, this method is not likely to be sustainable. What is missed is the organization’s opportunity to become more dynamic and nimble, one that uses its forecasting processes as a true competitive advantage to achieve superior results. We’ve seen several definitions, but we believe a rolling forecast is:
A typical forecast that only updates the budget is focused on achieving the goals for that fiscal year. The total number of periods evaluated is constant but the number of forecast periods is reduced by one period each time. The focus is typically on executing the plans that were made in the budget, regardless if the underlying assumptions are still valid. Instead of looking beyond the year, it stops suddenly in December as if business will not be conducted in January. In short, it follows an arbitrary cycle that does not align with the natural course of business. Thus, what could have been a valuable exercise becomes nothing more than a variance explanation and results in missed opportunities. The second question we get from our clients is, “If we adopt a rolling forecast, should we kill the budget?” The short answer is no; the long answer will come in our next entry where we demonstrate how a rolling forecast and the budget work together to enable the true execution of corporate strategy. |
AuthorSid Ghatak is the Chief Data Officer at Increase Alpha and lives at the intersection of the customer, business, and technology. Email him at [email protected] or follow him on Twitter to get insights on your world. ArchivesCategories |
 RSS Feed